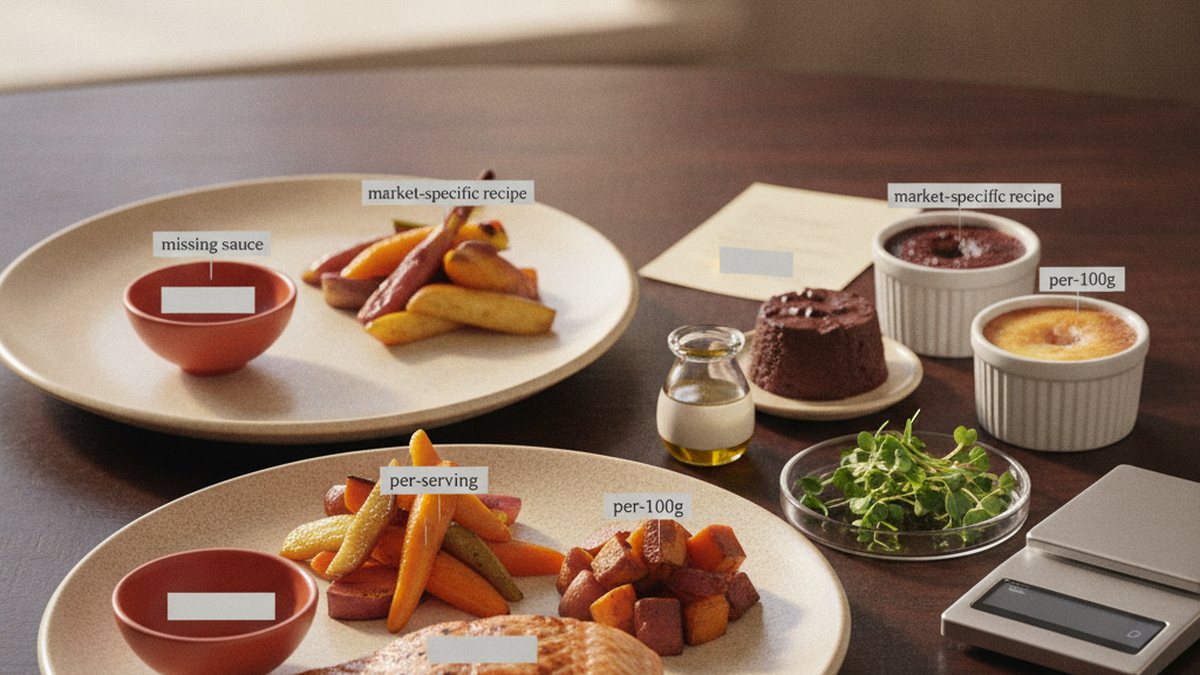
Restaurant nutrition data is genuinely useful and quietly full of traps. Most of them come from comparing two numbers that were never measuring the same thing.
Per serving versus per 100 grams
The most common error, and the easiest to make. Per-serving figures tell you what you are about to eat. Per-100g figures tell you how energy-dense the food is. They answer different questions and are not interchangeable.
A dressing can look modest per 100g and dominate an order per serving, because the serving is small but the density is enormous. A large item can look alarming per serving and be unremarkable per 100g. Both framings are honest; using the wrong one is not.
The rule
Compare two items using the same basis. If you are deciding what to order, use per serving. If you are deciding how much of something to have, use per 100g.
What the figure quietly excludes
Published nutrition figures usually describe the item as specified, which is not the same as the item as served. Commonly excluded:
| Frequently excluded | Why it matters |
|---|---|
| Sauces and dressings added at the counter | Often the densest component of the order |
| The drink in a combo | Can exceed the main item on its own |
| Optional extras and toppings | Cheese, bacon and extra patties are usually listed separately |
| Free refills | Not attributable to a single serving at all |
| Condiments taken at a self-service station | Genuinely unknowable to the restaurant |
None of this is deception. It is a definitional problem: a restaurant can publish a figure for what it makes and cannot publish one for what you assemble. But it does mean a combo's real total is usually meaningfully above the headline number for its main item.
The same name is not the same product
Recipes are local. Supply chains, regulations and taste preferences all differ, so a product sold under one name in two countries can differ in weight, formulation and cooking method.
A nutrition figure from one country is a figure about that country.
This is easy to see in the price data: the same product name frequently sits at very different price points across markets, and the comparison tool shows where two markets' menus diverge in composition as well as price. Where menus differ that much, recipes usually do too.
Calculated, not measured
Published restaurant nutrition data is almost always calculated from a standard recipe and standard ingredient specifications, not measured from a sample of what customers actually receive. That is a reasonable and normal method, and it has a consequence worth understanding.
Real portions vary. Sauce is applied by hand. A basket of fries is filled by a person. The published figure is a specification, and the item in front of you is an instance of it. Treat single-digit differences between two items as noise rather than signal.
Rounding and thresholds
Nutrition figures are typically rounded, and in some jurisdictions small amounts may be declared as zero below a threshold. "Zero" on a label often means "below the level at which we are required to declare it" rather than "none". This matters most for trans fats and for sugars in drinks.
Absence of data means nothing
The final and most important point. Most published menus carry no nutrition information at all. Across the 15,775 items in our database, 29 have a calorie figure. That is not evidence that unlabelled items are worse or better; it is evidence that nutrition data rarely travels with a published menu.
We publish exactly what a source menu carried and never estimate - The reasoning is on the methodology page. For which markets require labelling and which do not, see calorie labelling rules by country. For the practical version of all of this, ordering better at a chain restaurant gets further with four structural rules than any amount of number reading.